The problem
The original dashboard presented rates without enough geographic context. Long layouts made it harder to compare charts, find controls and inspect detailed values.
 Sadeq RezaiThe Working Studio
02 / Data products · R / Shiny
Compare currencies over time, convert an amount and select currencies on a world map. The R/Shiny app reuses saved rates and requests missing data from APILayer.
Working app. Public source.
Interactive explanation.
Inside the project
The map shows the software parts.
The animation shows when saved data or a new request is used.
Select a box to read its role, then use the button to watch the relevant example.
Compare currencies, request newer rates or see what happens when the provider asks the app to wait.Repeats automatically while in view. Pause to hold a moment.
These examples send no API requests and show no live provider activity. Open either view full-size to explore it in more detail.
The actual product
The work behind the interface
The original dashboard presented rates without enough geographic context. Long layouts made it harder to compare charts, find controls and inspect detailed values.
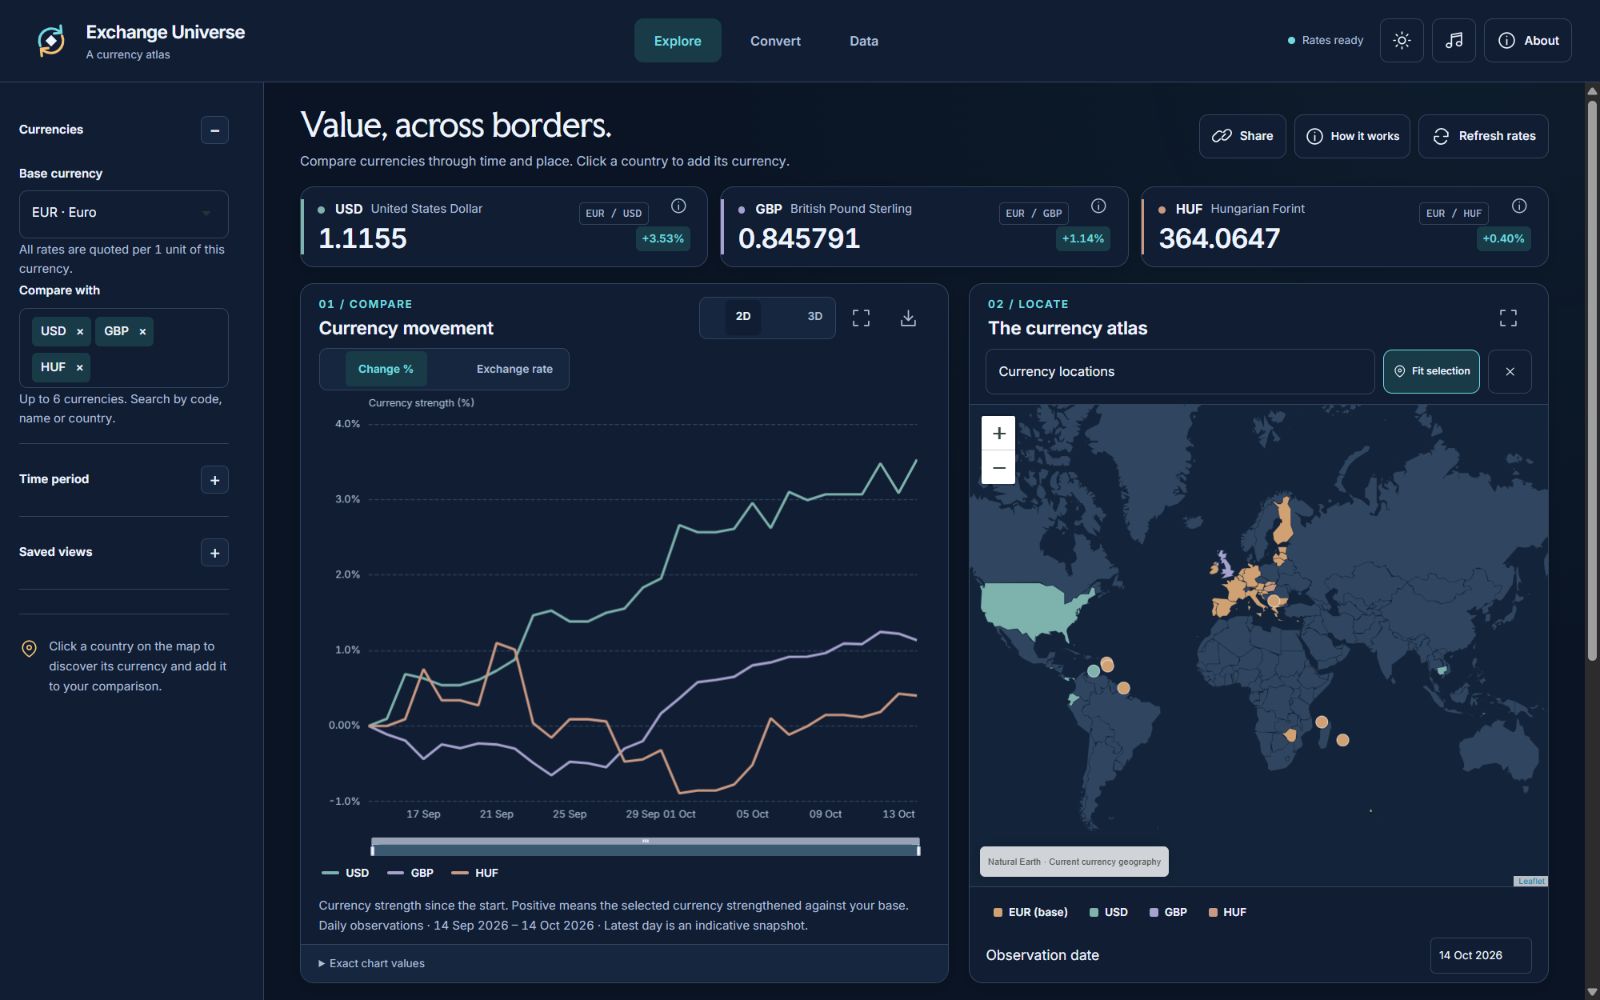
I reorganised the app into Explore, Convert and Data views, connected a Leaflet atlas to currency selection, and refined the interface for desktop and mobile. API integration and data preparation remain in R/Shiny.
Select a supported country to add or remove its currency from a comparison of up to six. Charts, map colours and exact-value tables follow the selection. Conversion, CSV export, optional 3D plots and fullscreen views offer different ways to inspect it.
Shared caches, bounded request queues, deduplication and retry backoff reduce unnecessary provider calls. Focused offline checks cover quota controls and date validation; they are not a complete security audit.
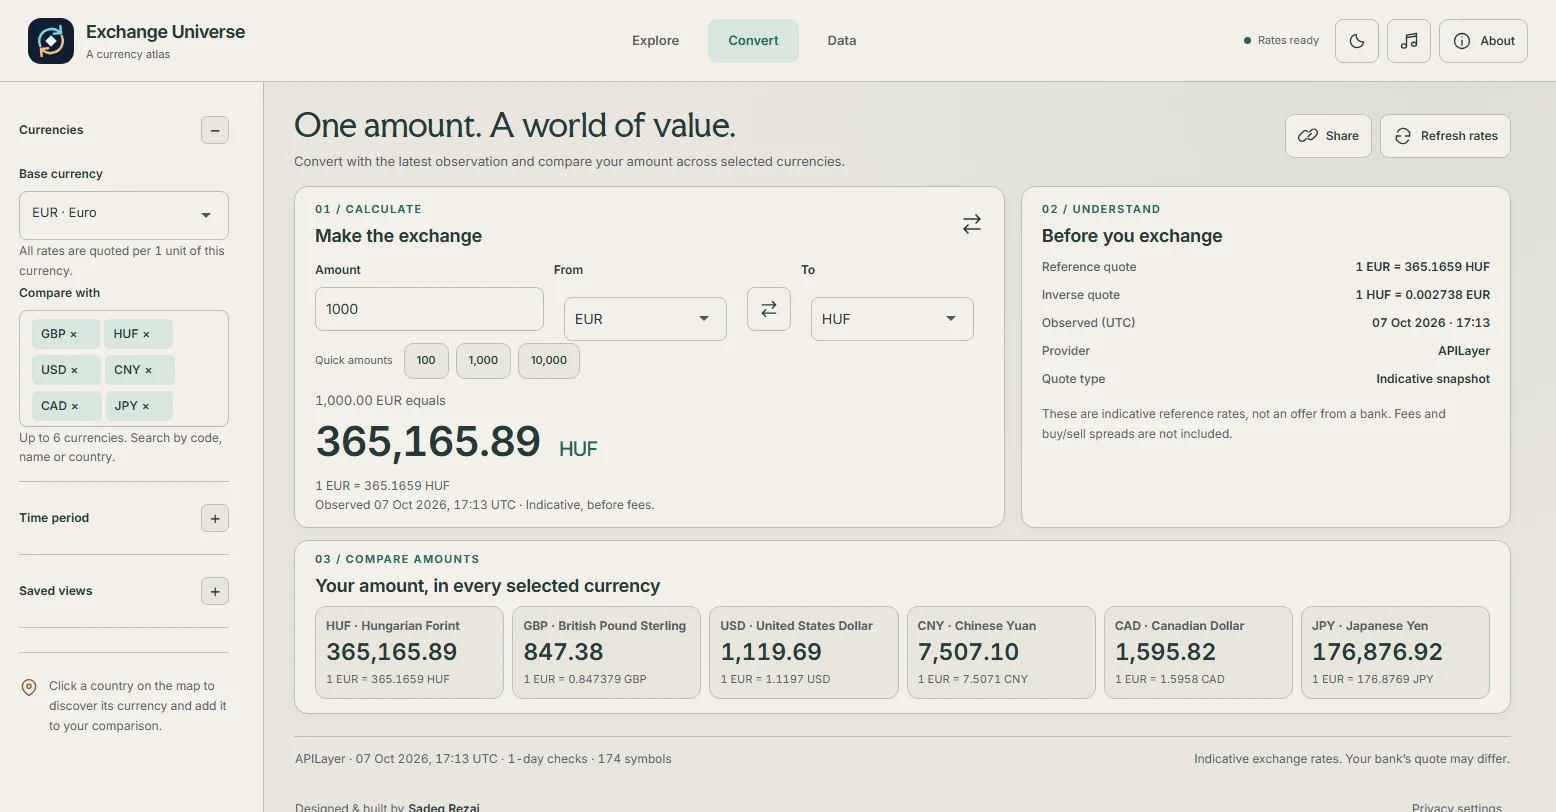

Historical observations are daily, not hourly. Quotes are indicative and exclude fees and buy/sell spreads. Coverage and freshness depend on the API plan. Shinyapps.io local storage is not a durable shared archive.
The map is a reviewed overview of a pinned source revision, not an automatically updated dependency graph or live telemetry. The animated guide is a simplified teaching example. Neither contacts the rate provider.
My focus: R/Shiny development, interface design, API integration, quota-aware caching and making those decisions easier to inspect.